 Promethean
The Brief
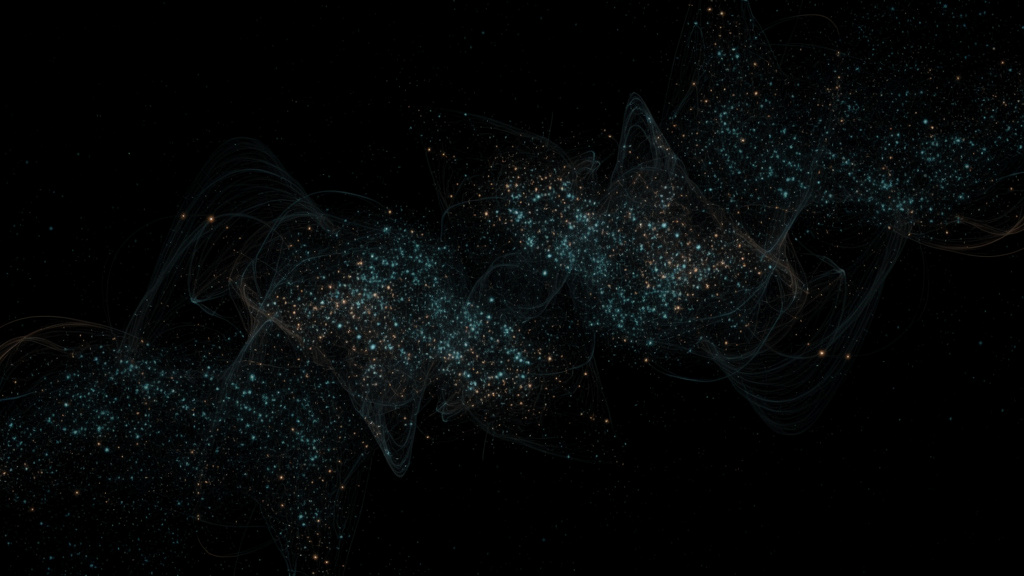
Astronomers using the Hobby-Eberly Telescope Dark Energy Experiment have produced the largest and most detailed 3D map of hydrogen light in the early universe, spanning 9 to 11 billion years ago — the epoch known as cosmic noon. The map, built from over 600 million spectra and published in The Astrophysical Journal, reveals a vast distribution of previously undetected faint galaxies and intergalactic gas filling the spaces between known bright galaxies.
The Report
A team led by Maja Lujan Niemeyer of the Max Planck Institute for Astrophysics has mapped the ultraviolet glow of excited hydrogen across a region of the early universe covering more than 2,000 full moons of sky, using data from the Hobby-Eberly Telescope at McDonald Observatory in Texas.
The map charts Lyman-alpha emissions — light produced when hydrogen atoms absorb stellar energy — from a period when the universe was between three and five billion years old, during its most productive era of star formation. Rather than cataloguing individual galaxies, the team employed a technique called Line Intensity Mapping, which measures the aggregate light across entire sky regions to detect sources too faint for conventional surveys. The approach processed approximately half a petabyte of spectral data using supercomputers at the Texas Advanced Computing Center.
The result reveals what the team describes as a “sea of light” in the apparently empty stretches between bright galaxies. “There’s a whole sea of light in the seemingly empty patches in between,” Niemeyer said. The bright galaxies previously catalogued, it turns out, represent only the most conspicuous features of a far denser landscape of fainter objects and diffuse gas.
Julian Muñoz, a HETDEX scientist at the University of Texas at Austin, compared the method to looking through a smudged plane window: “You get a blurrier picture, but you capture all the light and not just the brightest spots.” The technique uses the known positions of bright galaxies as gravitational signposts, calculating where fainter matter should cluster nearby.
The study draws on the first public HETDEX source catalogue of more than 50,000 Lyman-alpha emitters — yet the data used represents only around 5 per cent of HETDEX’s total collection. Karl Gebhardt, the experiment’s principal investigator at UT Austin, noted the scale of what remains unanalysed. Additional instruments coming online will allow researchers to overlay the hydrogen map with maps of other elements, including carbon monoxide, to build a more complete picture of star-forming conditions in the early universe.
Eiichiro Komatsu, scientific director at the Max Planck Institute for Astrophysics, said the map provides a foundation for testing the astrophysical models that have until now relied on computer simulations rather than direct observation. The study was published on 3 March 2026 in The Astrophysical Journal. Ninety-five per cent of the data collected by the telescope has not yet been used.
The Angle
The interesting number here is not 600 million. It is five per cent. The largest three-dimensional map of the early universe ever produced — a dataset substantial enough to reveal entire populations of galaxies that no previous survey could detect — was built from a twentieth of what the telescope has already gathered. The remaining 95 per cent is sitting on servers in Texas, waiting for someone to look at it.
This is worth pausing on, because it says something specific about where observational astronomy sits right now. The constraint is no longer collection. It is processing. The Hobby-Eberly Telescope is not limited by what it can see. It is limited by the computational capacity available to interpret what it has already seen. That ratio — a twentieth analysed, nineteen twentieths queued — is a measure of the distance between the instruments humanity has built and the infrastructure required to use them fully.
The map itself does what the best maps always do: it reveals that the territory was more populated than the previous cartography suggested. Bright galaxies were taken as the primary features of the early universe because they were the features detectable with existing methods. Line Intensity Mapping dissolves that selection bias. What emerges is not a correction of the old picture so much as an expansion of resolution — the difference between seeing a coastline from orbit and seeing the same coastline from a few thousand feet. The coast was always that shape. The detail was always there. The limitation was in the observation, not the landscape.
The period being mapped — cosmic noon, when the universe was forming stars at its highest rate — is the era that produced the conditions for everything that followed, including the chemistry that eventually became biology. Observing it directly, rather than simulating it, is the difference between working from a blueprint and inspecting the building. Komatsu’s point is precise: simulations are models, not evidence. Now there is evidence to test them against, from an era when the universe was assembling the raw material for the next ten billion years. And the instrument that produced it has barely started.
The tools are not the bottleneck. The willingness to build what processes their output is.